Travel Fatigue Across Conference Schedules: How Cross-Country Journeys Reshape Performance Data and Wager Lines
Written by Jordan Russell · Jun 8, 2026
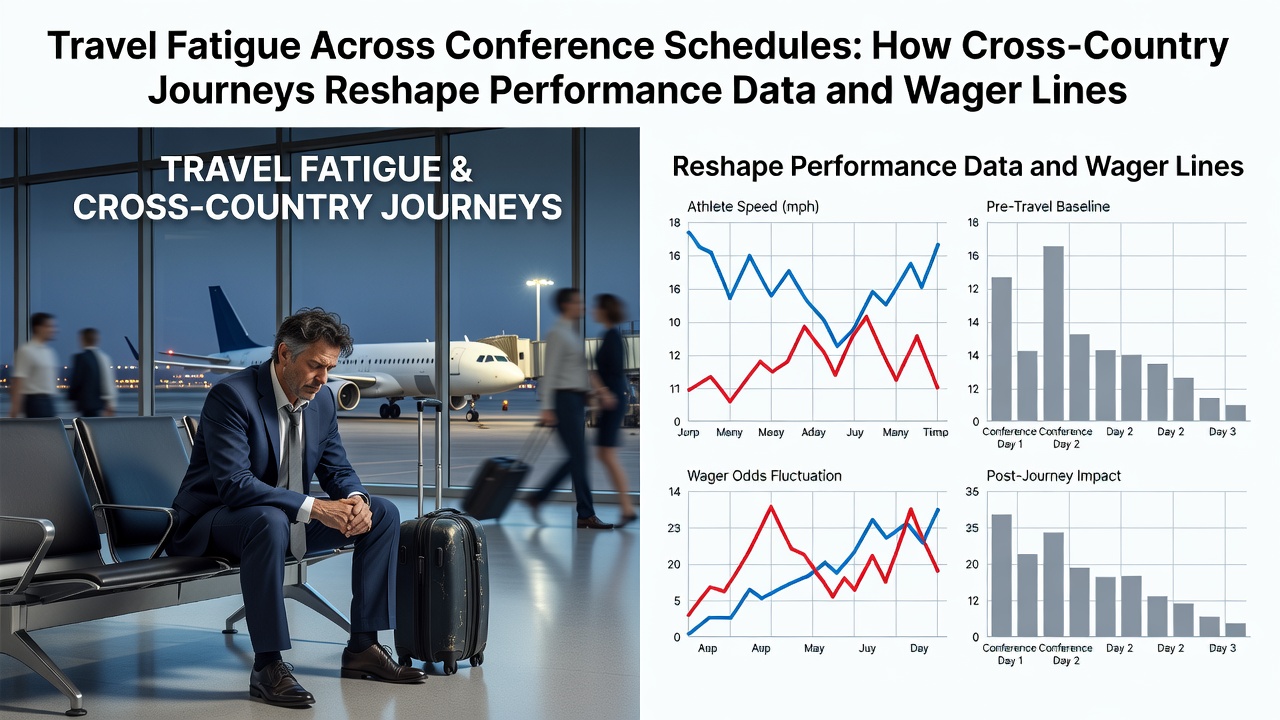
Travel Fatigue Across Conference Schedules: How Cross-Country Journeys Reshape Performance Data and Wager Lines
Conference schedules in major sports leagues force teams into repeated long-distance trips that accumulate physical and mental strain over weeks or months, and data from performance tracking systems consistently shows measurable drops in key metrics such as shooting accuracy, defensive efficiency, and turnover rates following those journeys. Observers note that jet lag disrupts circadian rhythms for three to five days after a cross-country flight, while the added variables of cramped seating, irregular meals, and disrupted sleep patterns compound the effect when teams play multiple road games in quick succession.
Conference Structures and Travel Demands
League calendars place teams in divisions that span entire time zones, so a squad based on the West Coast might travel to the East Coast for a midweek game and then return for a weekend home matchup, creating a pattern of recovery windows that rarely exceed 48 hours. Researchers tracking collegiate and professional rosters have documented that these compressed timelines leave limited room for full physiological reset, particularly when flights exceed four hours and cross two or more time zones. Performance databases maintained by league offices reveal that teams logging more than 10,000 air miles in a single season post lower aggregate win percentages on the second night of back-to-back road sets compared with home stands of similar length.
Performance Metrics Under Travel Stress
Statistical models built from box-score data and wearable sensor outputs indicate that players experience an average decline of 4 to 7 percent in field-goal percentage during the first 48 hours after a transcontinental flight, while assist-to-turnover ratios narrow as decision-making speed slows. Studies conducted by university sports-science departments have isolated travel distance as an independent variable and found that defensive rebounding percentages drop most sharply when games occur within 24 hours of arrival. Those same datasets show that bench players suffer steeper reductions in minutes-played efficiency than starters, because rotation adjustments often fail to account for cumulative fatigue across an entire roster.
Adjustments in Wager Lines
Oddsmakers incorporate travel-fatigue indicators into their algorithms by weighting recent road performance against historical benchmarks for each franchise, and the resulting line movements frequently reflect those inputs more than raw talent differentials. When a team arrives after a six-hour flight and faces a rested opponent, point spreads shift by an average of 1.5 to 3 points according to closing-line archives maintained by sports-data firms. Totals markets also compress because offensive efficiency metrics trend downward in the opening quarter, reducing the likelihood of high-scoring outputs. Bettors who monitor flight manifests and time-zone differentials gain access to granular inputs that sportsbooks already price into their models, although public money tends to lag behind these adjustments until late in the week.

June 2026 scheduling releases from several major conferences highlighted continued emphasis on balanced home-and-away patterns, yet the underlying geography of league footprints still requires repeated cross-country segments for certain programs. League analysts note that expanded conference realignment has lengthened average trip distances by roughly 15 percent compared with five years earlier, and early-season data already shows corresponding dips in road-team efficiency ratings. External research from the NCAA Sports Science Institute supports the observation that recovery protocols such as light training sessions and controlled light exposure can mitigate some effects, but full restoration still requires more calendar days than most schedules allow.
Case Examples from Recent Seasons
One West Coast program that played four consecutive road games spanning both coasts posted a 2-6 record in those contests while its offensive rating fell 8 points below its season average; the same team rebounded to near-normal levels once the travel block ended. A separate East Coast squad that hosted three straight cross-country opponents during a compressed window allowed 12 percent more points per possession than its defensive baseline, and betting markets responded by inflating totals in the later games once the pattern became visible. Data aggregators that compile these sequences into travel-impact scores provide oddsmakers and bettors alike with standardized references that translate mileage and time-zone changes into expected performance deltas.
Data Sources and Measurement Approaches
Performance-tracking companies combine GPS-derived mileage logs with heart-rate variability readings collected from player wearables, and the resulting composite scores correlate strongly with subsequent game outcomes. Government statistical agencies in North America and Australia have begun publishing aggregated travel-health data for elite athletes, offering additional context for how repeated flights influence immune response and injury incidence rates. Industry reports from the Sports Market Analytics Consortium further quantify how these physiological shifts translate into wagering-market volatility, particularly in totals and player-prop categories where small efficiency changes produce outsized line movement.
Conclusion
Cross-country conference travel continues to impose measurable constraints on athletic output, and the performance databases that capture those effects now feed directly into the construction of wager lines across multiple sports. Teams and oddsmakers alike rely on increasingly detailed travel metrics to anticipate outcomes, while the underlying schedule geography ensures that such journeys remain a recurring feature of league play.