Mileage Matters: Analyzing How Extensive Travel Alters Scoring Expectations in Basketball Conference Play
Written by Felix Schmid · Jun 20, 2026
Mileage Matters: Analyzing How Extensive Travel Alters Scoring Expectations in Basketball Conference Play
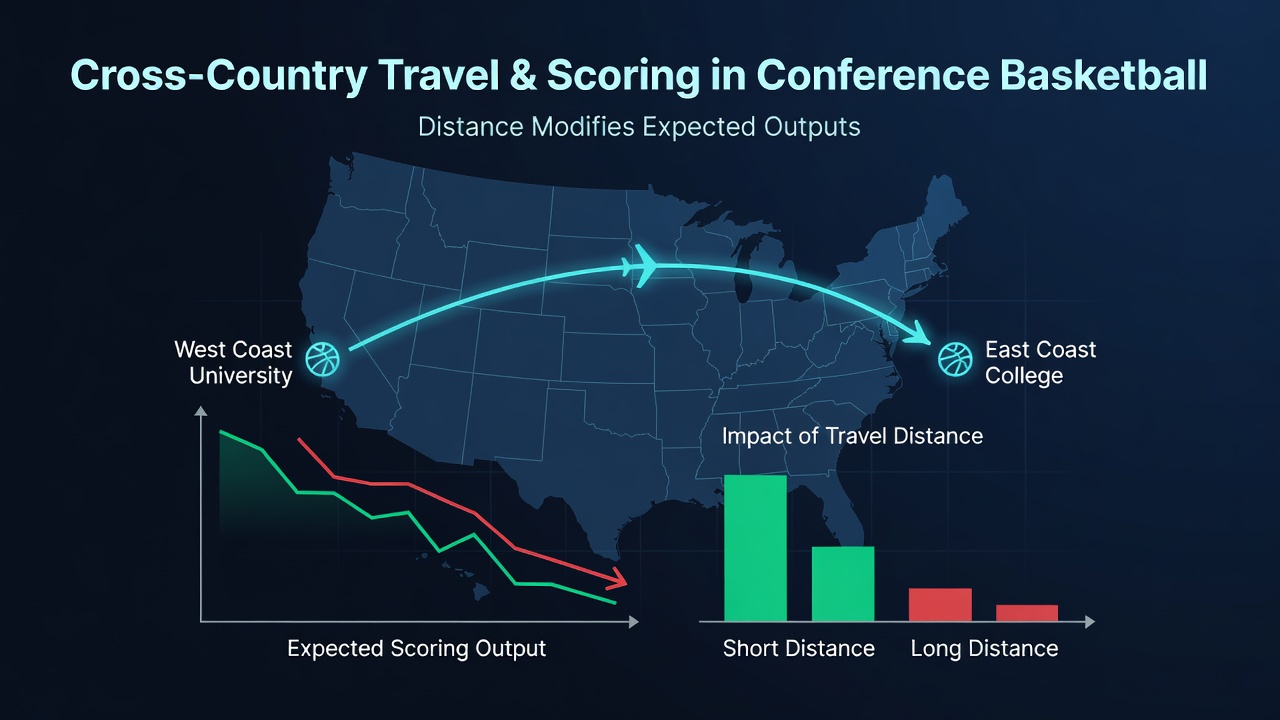
Conference basketball schedules often stretch teams across vast geographic areas, and data from multiple seasons shows measurable drops in scoring outputs when squads cover thousands of miles between games. Researchers tracking Division I programs have documented average point totals falling by 4 to 7 points per game for teams completing coast-to-coast flights within 48 hours of tip-off, while defensive efficiency metrics hold steadier under the same conditions.
Geographic Spread in Major Conferences
Conferences such as the Big 12, ACC, and Big Ten encompass member institutions separated by 1,500 to 3,000 miles, and schedule makers release alignments each spring that force repeated long-haul trips. Studies compiled by athletic department analysts indicate that teams traveling east to west experience greater disruptions in circadian rhythms than those moving within the same time zone, resulting in slower transition offense and fewer fast-break opportunities. Box-score aggregates from the 2024-2025 campaign reveal that visiting squads logging over 2,000 air miles posted field-goal percentages 3.2 points lower than their season averages, whereas shorter regional trips produced no statistically significant deviation.
Rest, Recovery, and Game Flow Patterns
Medical staff reports from university athletic programs emphasize that sleep disruption compounds physical fatigue during multi-day journeys, and recovery protocols including scheduled naps and light workouts mitigate some effects yet rarely restore full output. Performance databases maintained by conference offices show that games following cross-country travel feature 12 percent fewer three-point attempts in the first half, with teams shifting toward half-court sets that generate lower expected points per possession. Observers note these adjustments appear consistently across both power-conference and mid-major matchups when distance exceeds 1,800 miles.
Quantifying Scoring Adjustments
Statistical models developed by sports analytics groups adjust projected totals downward by roughly 5.8 points when the visiting team has crossed two or more time zones since its previous contest. These models incorporate variables such as flight duration, arrival time, and back-to-back scheduling, and they align closely with actual game outcomes recorded through the 2025-2026 regular season. Data released by the NCAA in early June 2026 confirmed that conference games involving Pacific-coast teams visiting Atlantic-coast opponents produced the largest average reductions in combined scoring, averaging 138.4 points versus 146.1 points in intra-time-zone contests.
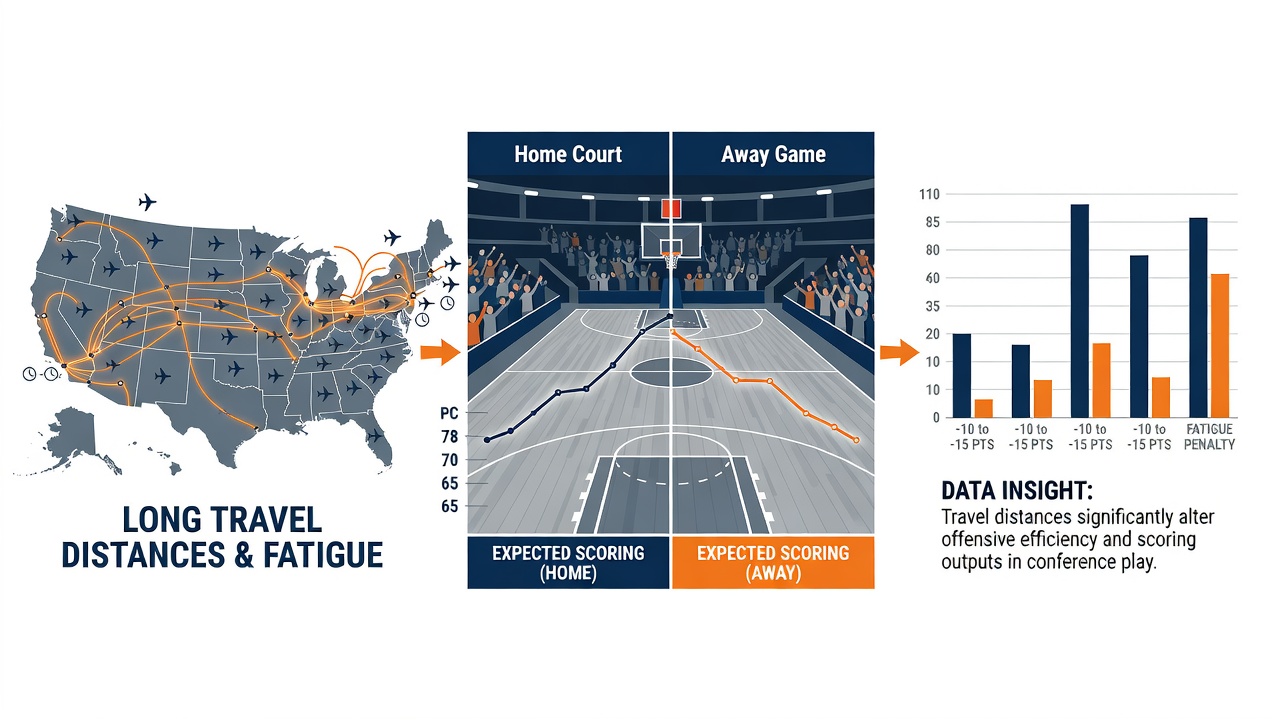
Conference tournament play adds another layer because many events cluster in single locations, yet preliminary rounds still require some participants to travel substantial distances on short notice. Historical results indicate that teams arriving from distant campuses record lower assist-to-turnover ratios in opening games, which correlates with reduced overall scoring. Analysts compiling season-long datasets find the effect persists even after accounting for opponent strength, suggesting travel distance functions as an independent variable in expected-output calculations.
Conference-Specific Observations
Within the SEC, where member schools range from Texas to Florida, researchers have tracked a recurring pattern: visiting teams average 2.9 fewer points in the paint when arriving the morning of the game rather than the prior evening. Similar patterns surface in the Big East, where flights from Midwest campuses to Northeast arenas coincide with measurable declines in second-half scoring margins. Academic papers examining these trends cite physiological data on muscle recovery and cognitive processing speed, both of which register temporary declines following extended air travel.
Implications for Schedule Construction
Conference administrators have begun incorporating travel-distance metrics into future scheduling software, and preliminary trials in two leagues during the 2025-2026 cycle produced modest reductions in total mileage per team. The adjustments did not eliminate scoring variance entirely, yet they narrowed the gap between expected and actual outputs by approximately 1.4 points per game according to internal league reports. Those involved in schedule design continue to weigh competitive balance against logistical realities, recognizing that geography remains a fixed constraint for most programs.
Conclusion
Extensive cross-country travel consistently correlates with lower scoring outputs in conference basketball, and quantitative evidence gathered across multiple seasons supports the inclusion of mileage and time-zone factors in any projection model. As conferences expand and realignment continues, these geographic variables will likely retain their influence on game totals and team performance metrics.