Fixture Density Tracking and Adaptive Wagering Frameworks in Professional Team Leagues
Written by Felix Schmid · Aug 24, 2026
Fixture Density Tracking and Adaptive Wagering Frameworks in Professional Team Leagues
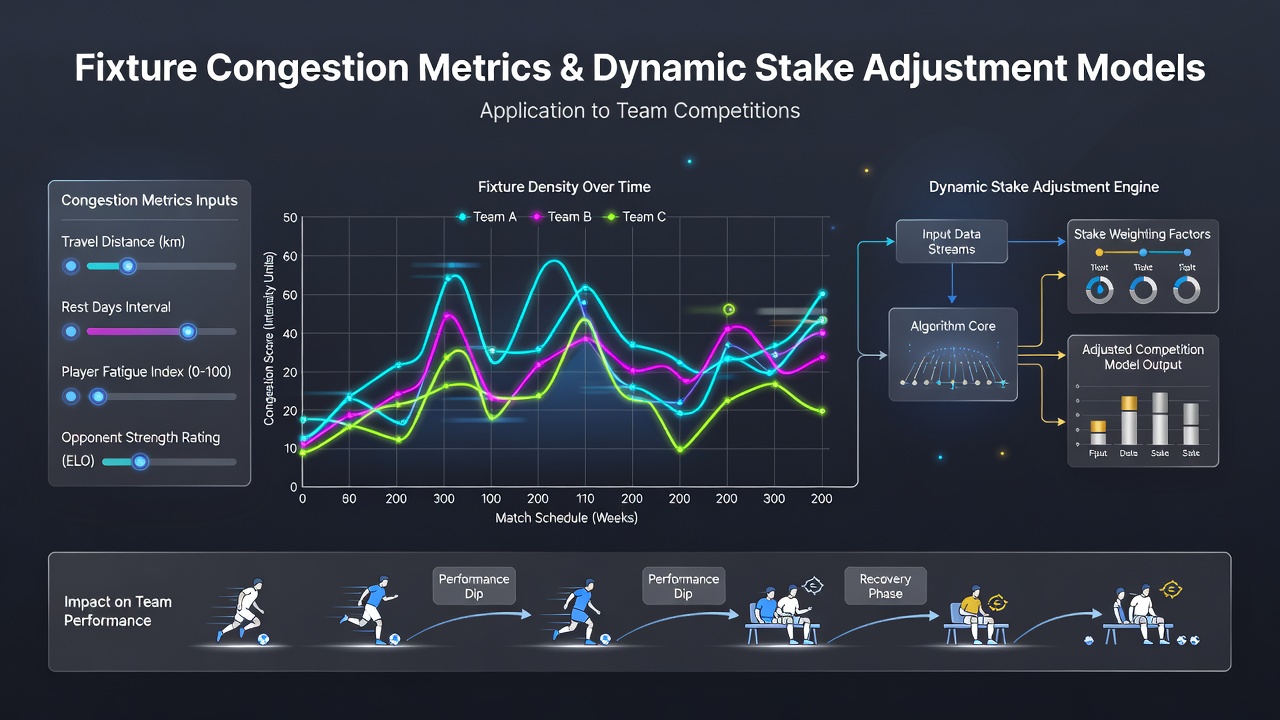
Fixture congestion metrics quantify the cumulative load placed on teams through successive matches separated by short recovery intervals, and researchers track these variables to inform dynamic stake adjustment models used in competitive wagering environments. Data collection typically incorporates match frequency per 14-day window, cumulative travel kilometers, and days between fixtures, while analysts integrate these inputs into algorithms that recalibrate stake sizes based on projected performance variance.
Core Components of Congestion Measurement
Teams competing in domestic leagues and international tournaments often encounter clusters of three or more matches within seven days, and statisticians record these sequences alongside physiological indicators such as average sprint distance and heart-rate recovery rates collected from wearable devices. Studies from sports science departments at institutions in Germany and Australia demonstrate that elevated fixture counts correlate with measurable declines in expected goal differentials and point margins, which in turn influence the weighting factors applied within stake-adjustment formulas.
League schedules released for the 2026 season show several conferences compressing midweek cup ties into August calendars, and analysts note that clubs facing four fixtures across 12 days receive elevated congestion scores that trigger automatic reductions in recommended stake allocations. These adjustments operate through tiered thresholds where scores above a defined index prompt proportional stake decreases ranging from 15 to 35 percent depending on the model parameters.
Integration With Dynamic Stake Models
Dynamic stake models ingest real-time congestion indices alongside historical performance datasets, and operators apply regression techniques to determine stake multipliers that reflect diminished team output under overload conditions. When a squad logs more than 450 minutes of competitive play within a 10-day span, the corresponding model layer lowers exposure on that side while reallocating capital toward fixtures featuring lower cumulative loads for opposing sides.
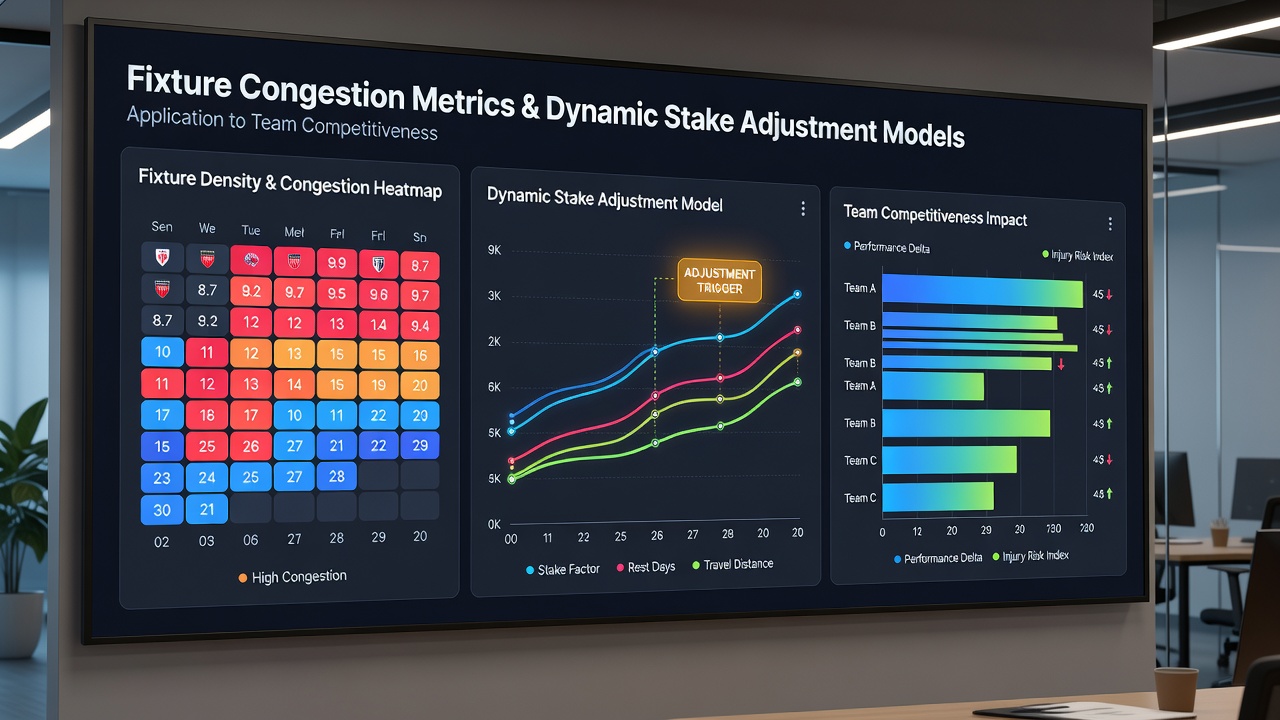
European regulatory filings from oversight bodies in Malta and the Netherlands require operators to document how congestion variables feed into automated risk engines, and these disclosures reveal that models recalibrate every 24 hours once updated travel and recovery data become available. Australian research groups have published parallel findings showing that cross-continental travel exceeding 8,000 kilometers in a single month amplifies the effect of fixture density on total points scored, prompting further downward adjustments in stake sizing for affected squads.
League-Specific Patterns and Data Inputs
North American professional circuits publish granular scheduling files that include exact kickoff times and venue coordinates, allowing model developers to compute precise recovery windows between games. One documented case from the 2025-26 campaign involved a franchise completing five road contests in 15 days, after which congestion metrics elevated sufficiently to reduce stake recommendations on that team by 28 percent in subsequent matches according to aggregated industry datasets.
Asian and South American confederations have begun publishing comparable fixture-density reports ahead of August 2026 qualification windows, and these documents supply additional inputs for global stake-adjustment engines that operate across multiple markets simultaneously. Observers note that models incorporating both domestic and continental congestion layers produce more stable return distributions than single-league variants, because overlapping schedules create compounded load effects not captured in isolated calculations.
Conclusion
Fixture congestion metrics continue to supply quantitative foundations for dynamic stake adjustment systems deployed across professional team competitions, and ongoing data streams from league authorities and academic partners support iterative refinement of these frameworks. As schedules evolve through late 2026, updated congestion indices will remain central to maintaining calibrated exposure levels within competitive wagering environments.