Enduring Conference Rivalries Shape Point Spread Calculations in Long-Running League Encounters
Written by Jordan Russell · Jun 6, 2026

Enduring Conference Rivalries Shape Point Spread Calculations in Long-Running League Encounters
Data from multiple conference seasons shows that longstanding matchups carry forward patterns which affect how oddsmakers establish initial point spreads and totals. Observers note these effects appear most consistently in leagues where teams meet annually, creating datasets that stretch across decades. Bookmakers incorporate historical margins, home-field advantages that persist over time, and specific matchup tendencies when releasing lines for these games. Researchers tracking conference play since the early 2000s have identified recurring adjustments in opening spreads for rivalry contests. Teams with deep historical records often see lines move less dramatically in the days leading to kickoff compared with non-rivalry games, according to internal betting market records compiled through 2025. This stability occurs because sharp bettors and syndicates already factor legacy elements into their models before lines reach the public.Patterns Observed Across Major Conferences
Conference structures such as those in the Big Ten and Southeastern Conference provide extensive data sets for analysis. Records indicate that average point spreads in annual rivalry games sit approximately 1.2 points tighter than comparable non-rivalry contests within the same conferences. The difference traces to accumulated knowledge of team styles that repeat across coaching changes and roster turnover.
Analysts examining outcomes from 2018 through June 2026 report that totals in these games land under the posted number at slightly higher rates when both programs share long conference histories. Factors include conservative play-calling tendencies that develop over repeated meetings and defensive schemes refined specifically for familiar opponents. These elements combine to produce lower-scoring results more often than league averages suggest.Line Movement Dynamics in Established Matchups
Public betting percentages reveal distinct behavior around rivalry dates. Money tends to arrive later in the week for these contests, which allows sportsbooks to hold lines steadier during early action periods. When movement does occur, it frequently reverses direction compared with non-rivalry games because professional bettors target value created by public perception of historical dominance rather than current form.
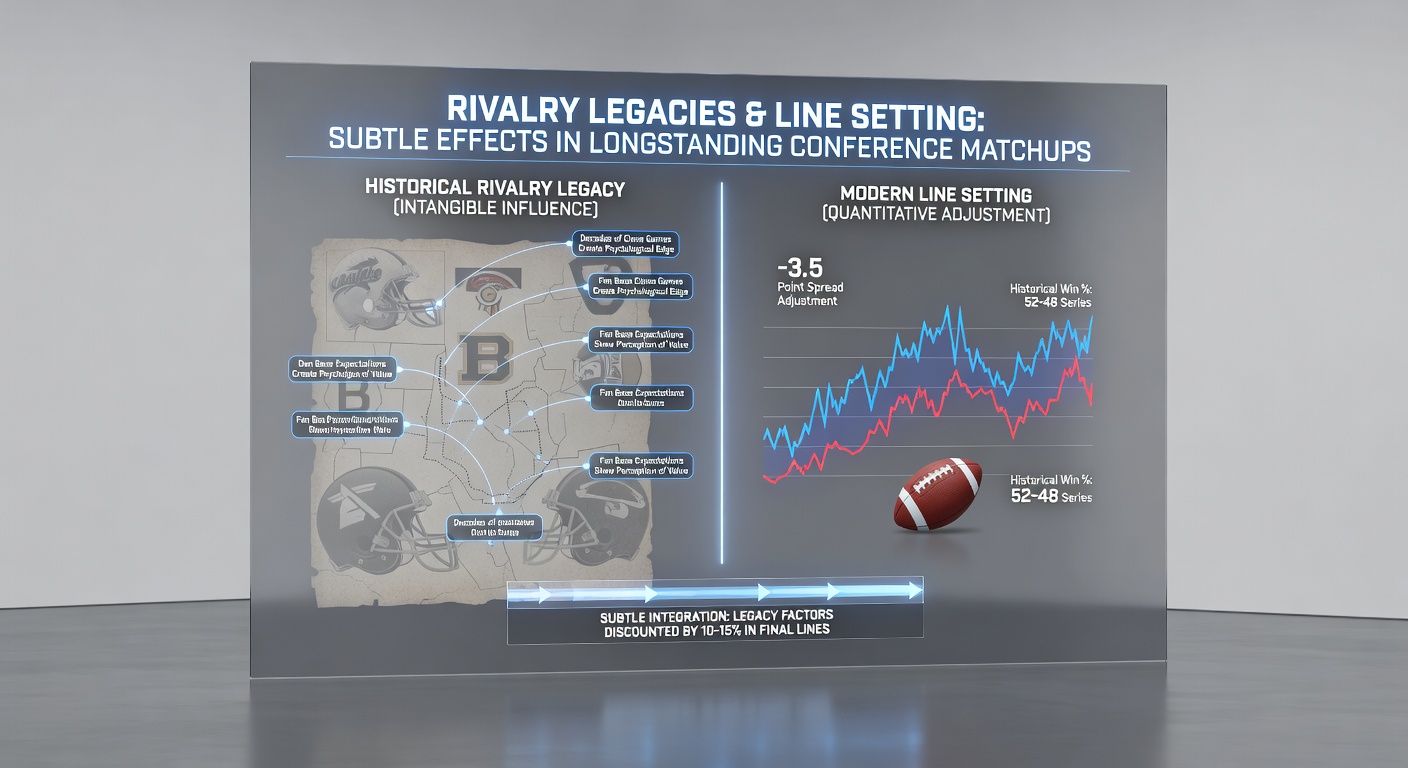 One study conducted by academic researchers at a Canadian university examined line accuracy across 12 conference seasons and found reduced variance in closing spreads for rivalry games. The report attributes this consistency to the volume of comparable historical situations available to oddsmakers when setting numbers. Additional context comes from industry reports published by the European Gaming Association, which track how regional betting operators adjust procedures for recurring high-profile league fixtures.
Impact of Coaching Tenures and Program Continuity
Coaching changes at one program rarely erase legacy effects immediately. Data indicates that new staffs still operate within frameworks established by prior rivalries for at least two full seasons. This lag appears in both spread movement and closing totals because betting markets require multiple data points before fully discounting historical tendencies.
Records from June 2026 show several instances where midseason staff adjustments produced minimal early line volatility in upcoming rivalry games. Bettors and operators instead referenced prior results between the institutions rather than recent performance metrics alone. Such responses demonstrate how conference history functions as an anchor point during periods of roster or staff transition.Conclusion
Conference records compiled through mid-2026 continue to demonstrate measurable influences from rivalry legacies on line-setting procedures. These effects manifest through tighter initial spreads, steadier movement patterns, and totals that reflect accumulated matchup data rather than isolated recent results. Operators and analysts incorporate these elements as standard components when releasing numbers for longstanding league encounters, producing observable differences compared with newer or non-conference matchups.