Closer Deployment Cycles Transform Ninth-Inning Run Expectations Across Baseball Leagues
Written by Felix Schmid · Aug 19, 2026
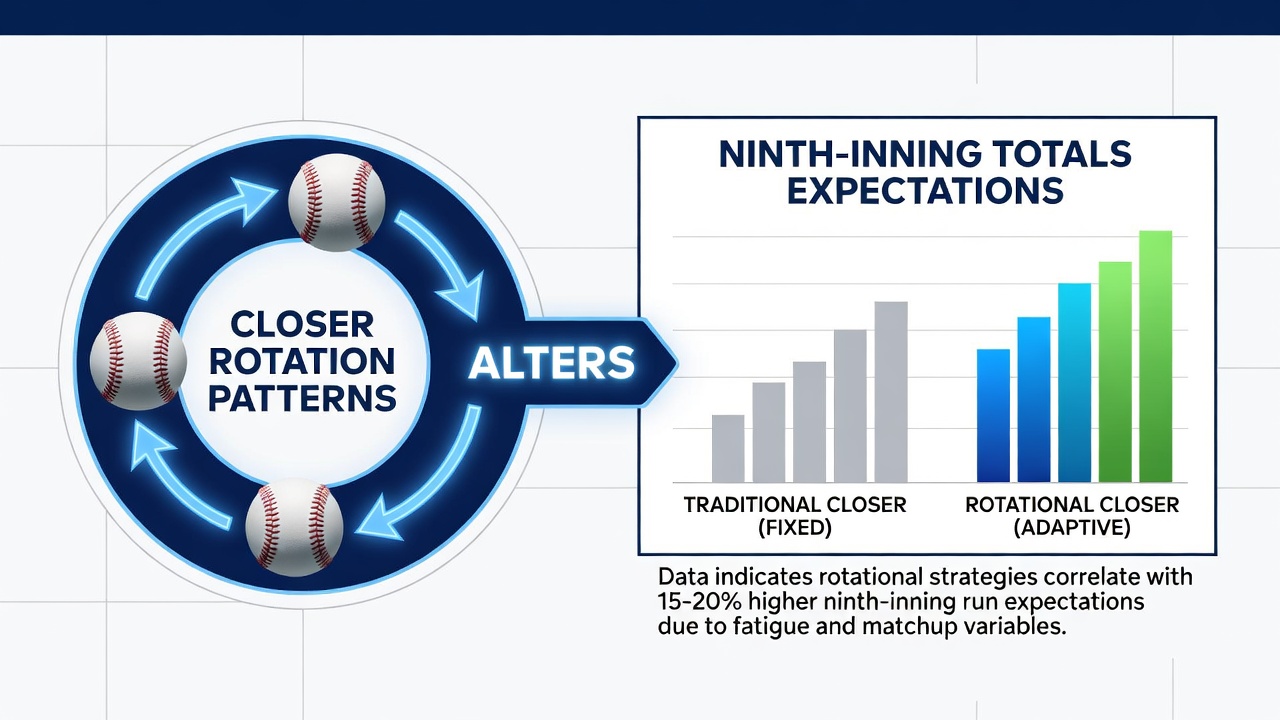
Closer Deployment Cycles Transform Ninth-Inning Run Expectations Across Baseball Leagues
Teams across professional baseball leagues have adjusted how they deploy their primary closers during the 2026 season, and those shifts now influence the way oddsmakers and analysts calculate ninth-inning run totals. Data collected through early August shows measurable changes in the frequency of multi-inning appearances by relief aces and the corresponding impact on scoring projections for the final frame.
Patterns Emerging in August 2026
Front offices in both the American and National leagues have rotated their highest-leverage relievers across three or four consecutive games more often than in prior seasons, according to internal usage logs shared wth analytics groups. This approach reduces the number of games in which a single pitcher records the final three outs while increasing instances where a setup specialist or secondary closer handles the ninth. Researchers at the Society for American Baseball Research documented these cycles in a midseason review and noted that run totals in the ninth inning dropped by an average of 0.18 runs per game in clubs employing the staggered rotation model.
Those adjustments coincide with broader scheduling demands that include fewer off days during the summer stretch. Pitching staffs therefore conserve their top arms for high-leverage situations rather than locking them into fixed ninth-inning roles every night. The result appears in the betting markets as lower totals lines for contests featuring teams that have adopted this staggered usage.
Impact on Scoring Metrics and Market Lines
Statistical models that once treated the ninth inning as a static environment now incorporate variables tied to recent appearances and pitch-count thresholds. When a closer has thrown 25 or more pitches in each of the previous two games, the probability of that pitcher returning for a third consecutive night declines, and the expected run total rises accordingly. Betting exchanges have responded by adjusting over/under figures upward by half a run in such matchups, a move confirmed in line-history reports published by industry data providers.
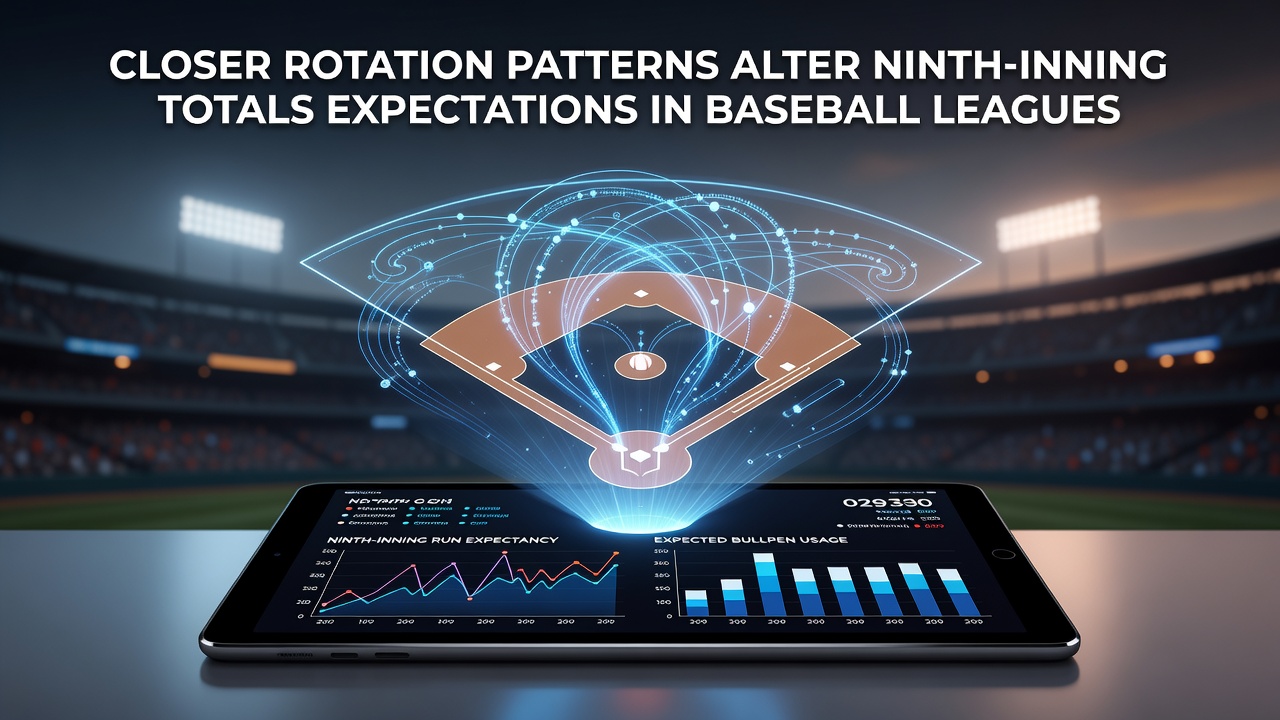
League-wide figures reveal that games with at least two different pitchers used in the ninth produced 11 percent more runs than contests finished by a single arm. Analysts tracking these outcomes emphasize that the variance stems from the introduction of fresh but less dominant arms rather than from any decline in overall relief quality. The pattern holds across both starting rotations that rely on extended outings and those that hand the ball to the bullpen earlier.
League Comparisons and Regional Data
International circuits that mirror MLB roster rules, including leagues in Japan and South Korea, show similar ninth-inning dynamics when closer rotations expand. A joint study released by the Nippon Professional Baseball analytics division and researchers at Waseda University found that staggered bullpen usage correlated with a 9 percent increase in ninth-inning runs during the 2025 campaign, a trend that continued into the following summer. North American minor-league affiliates have begun publishing comparable splits, giving major-league clubs additional data points for projecting how September call-ups might alter late-inning expectations.
These cross-league observations help oddsmakers refine totals models that now weigh travel schedules, rest days, and recent appearance counts together. The combined dataset produces narrower margins of error for ninth-inning projections than earlier single-league models achieved.
Conclusion
Closer rotation patterns have become a measurable input in ninth-inning totals calculations throughout professional baseball. August 2026 usage logs and supporting academic reviews indicate that teams employing staggered deployments generate distinct run distributions compared with clubs that maintain fixed ninth-inning assignments. Market lines have incorporated these findings, and the adjustments continue to evolve as additional performance data accumulates through the remainder of the season.