Aggregated Ticket Data Maps Shifting Public Sentiment for Smarter Multi-Sport Parlay Design
Written by Freya Vogel · Jul 20, 2026
Aggregated Ticket Data Maps Shifting Public Sentiment for Smarter Multi-Sport Parlay Design
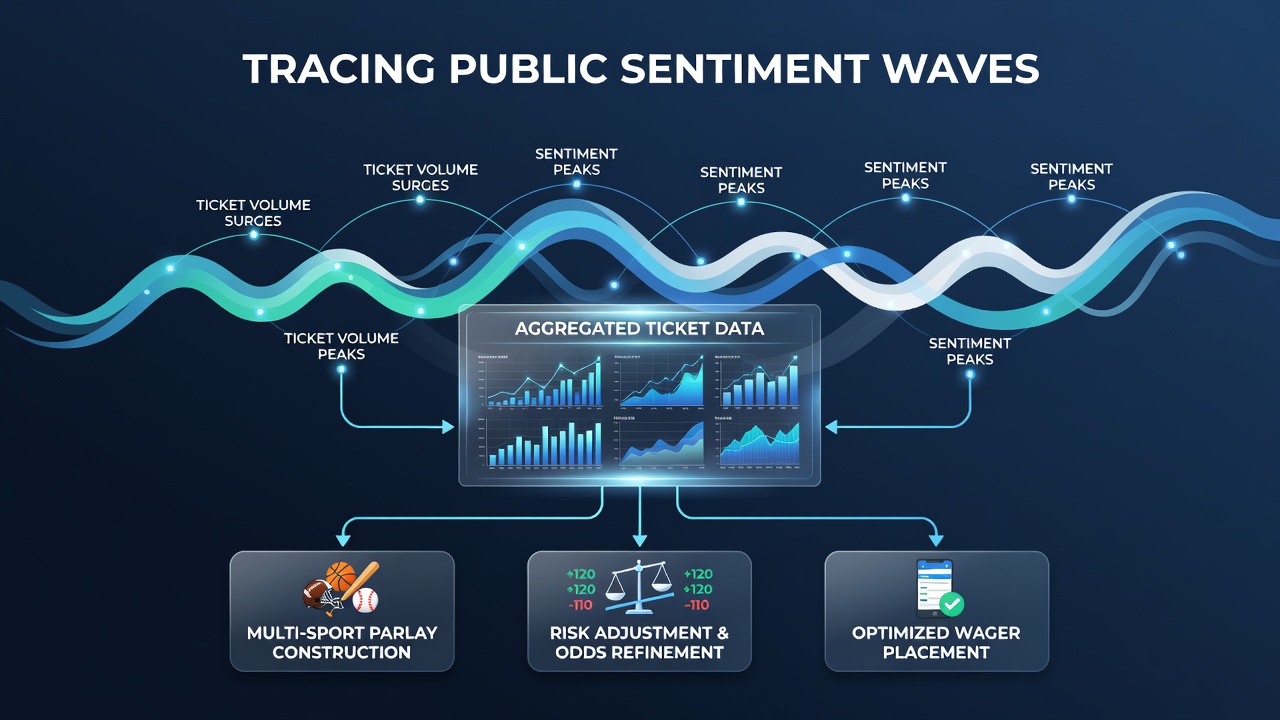
Betting platforms now compile ticket volumes from thousands of accounts each day, and these aggregates create visible waves that reflect where public money flows across different sports and bet types. Analysts track spikes in parlay selections that combine outcomes from football, basketball, baseball, and hockey, while the resulting datasets highlight correlations that single-league records alone cannot reveal.
Collecting and Normalizing Ticket Volumes Across Markets
Operators record every parlay ticket that includes at least two legs from separate leagues, then strip personal identifiers before releasing anonymized counts to research teams. These counts arrive in hourly feeds that include stake size ranges, so researchers can separate high-volume recreational tickets from larger professional wagers without accessing individual accounts. Data from July 2026 shows a measurable uptick in cross-sport parlays that pair NBA summer league results with MLB totals, a combination that had not appeared in comparable volume during the same period in prior years.
Identifying Sentiment Waves in Real Time
Sentiment waves emerge when normalized ticket percentages cross established thresholds for three consecutive hours. A wave that begins with heavy public support for underdogs in one league often spreads to correlated selections in another sport within the same evening window. Observers note that these movements frequently precede line adjustments issued by oddsmakers, because the aggregated data captures directional pressure before it registers in official odds. Research indicates that waves lasting longer than six hours tend to produce measurable reversals once sharp money counters the initial public surge.
Linking Sentiment Patterns to Parlay Construction Rules
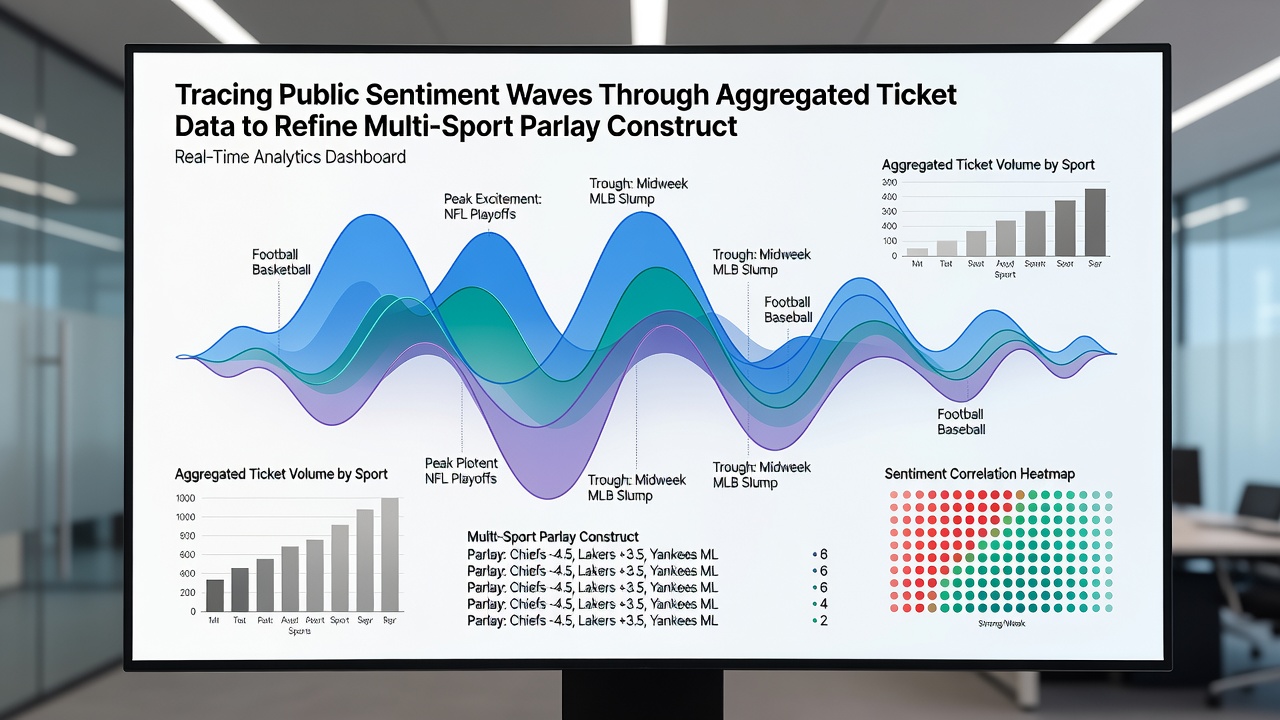
Multi-sport parlay builders apply filters derived directly from the wave data rather than relying on historical win rates alone. When a positive sentiment wave appears in college football totals, constructors reduce exposure to correlated NBA player props that have shown inverse movement in the same dataset. This adjustment occurs because the ticket aggregates demonstrate that simultaneous public enthusiasm across those markets has historically reduced payout frequency. Builders also monitor negative waves, which appear as sudden drops in ticket volume, and use those quiet periods to add legs that have previously performed well when overall activity remains low.
Geographic and Temporal Variations in Wave Behavior
Regional differences appear clearly in the aggregated feeds. Markets in teh western United States display stronger evening waves tied to late-starting Pacific games, whereas eastern feeds show earlier peaks aligned with afternoon European soccer fixtures. According to figures released by the Nevada Gaming Control Board, the proportion of multi-sport parlays containing at least one international leg rose from 12 percent in July 2025 to 19 percent in July 2026. Temporal analysis further reveals that waves compress during holiday weekends, with ticket activity clustering into shorter, more intense bursts rather than the extended patterns observed on ordinary weekdays.
Case Examples From Recent Data Windows
One documented window in early July 2026 captured a wave that began with heavy ticket volume on MLB run totals and expanded within four hours to include WNBA player points props. Constructors who removed the WNBA legs from active parlays after the wave peaked recorded a higher settlement rate than those who retained the original structure. Another example involved a negative wave in tennis that coincided with reduced interest in NHL futures; builders who added NHL legs during that quiet interval captured improved aggregate returns across their ticket portfolio. These instances illustrate how the ticket data supplies actionable signals rather than retrospective explanations.
Integration With Existing Risk Models
Risk teams incorporate wave thresholds into automated alerts that flag when public ticket percentages exceed historical norms for specific cross-league combinations. The alerts trigger review of stake limits and leg restrictions before the wave extends into additional sports. Because the underlying data remains anonymized and aggregated, the process respects regulatory boundaries while still delivering granular insight into collective behavior. Reports from the Australian Communications and Media Authority confirm that similar aggregation techniques have been tested in regulated markets outside North America, with comparable patterns emerging around major international tournaments.
Conclusion
Aggregated ticket data supplies a continuous record of where public attention concentrates across multiple sports simultaneously. Builders who map the resulting sentiment waves gain a timing mechanism that refines leg selection and stake distribution without requiring access to individual account details. As platforms continue to release normalized feeds, the practice of aligning parlay structures with observable wave patterns becomes a documented component of data-driven sports wagering analysis.